
An operations lead, call her Dana, is sitting in a procurement review with a decision she cannot defer. Her team has a backlog the agent on the screen would clear, and a board that has already heard the word "agent" three times this quarter. The vendor has a strong deck. The slide says the agent completed the task. The accuracy number is good. The dashboard behind it is reassuringly green. If Dana signs, the agent goes live against real customer records on Monday; if she stalls, she is the bottleneck. That is the jeopardy in the room, and it is the familiar kind: a capable person, a real deadline, and not enough to go on.
There is one sentence I would want Dana to say, calmly, before she reaches for the purchase order.
Show me the run.
It is the most useful sentence I know in AI procurement, and it is more useful than the questions it replaces. It is not "what is your accuracy?", which gives you a population statistic. It is not "which model is under the hood?", which names a component, not a behaviour. And it is emphatically not "show me the dashboard." Just: pull up one run, end to end. The decisions the agent made, the tools it called, the things it observed, the checks that ran, the points where a human stepped in, the final artefact, and a run identifier sitting at the top of all of it. One trajectory, read like a story.
This is not an abstract worry. In Kohls v. Ellison, a US federal court struck Professor Jeff Hancock's GPT-4o-assisted expert declaration on 10 January 2025 because the workflow that produced it left no inspectable run behind its citations: exactly the kind of artefact "show me the run" is built to surface before signing, not after filing [12]. Dana's scene is a disclosed composite, drawn from procurement reviews I have sat in rather than a single named buyer, but the failure underneath it is on the public record.
Essay 14, "Agents Don't Know When To Stop", argued that an agent needs a stopping rule. But a stopping rule is only worth anything if the system leaves evidence of why it stopped, continued, or escalated. If the agent says it handed off to a human, you should be able to see the human. If it says the verifier passed, you should be able to see the verifier. This essay is about that evidence, and about a single habit that follows from it. Do not begin with the dashboard. Begin with one complete run.
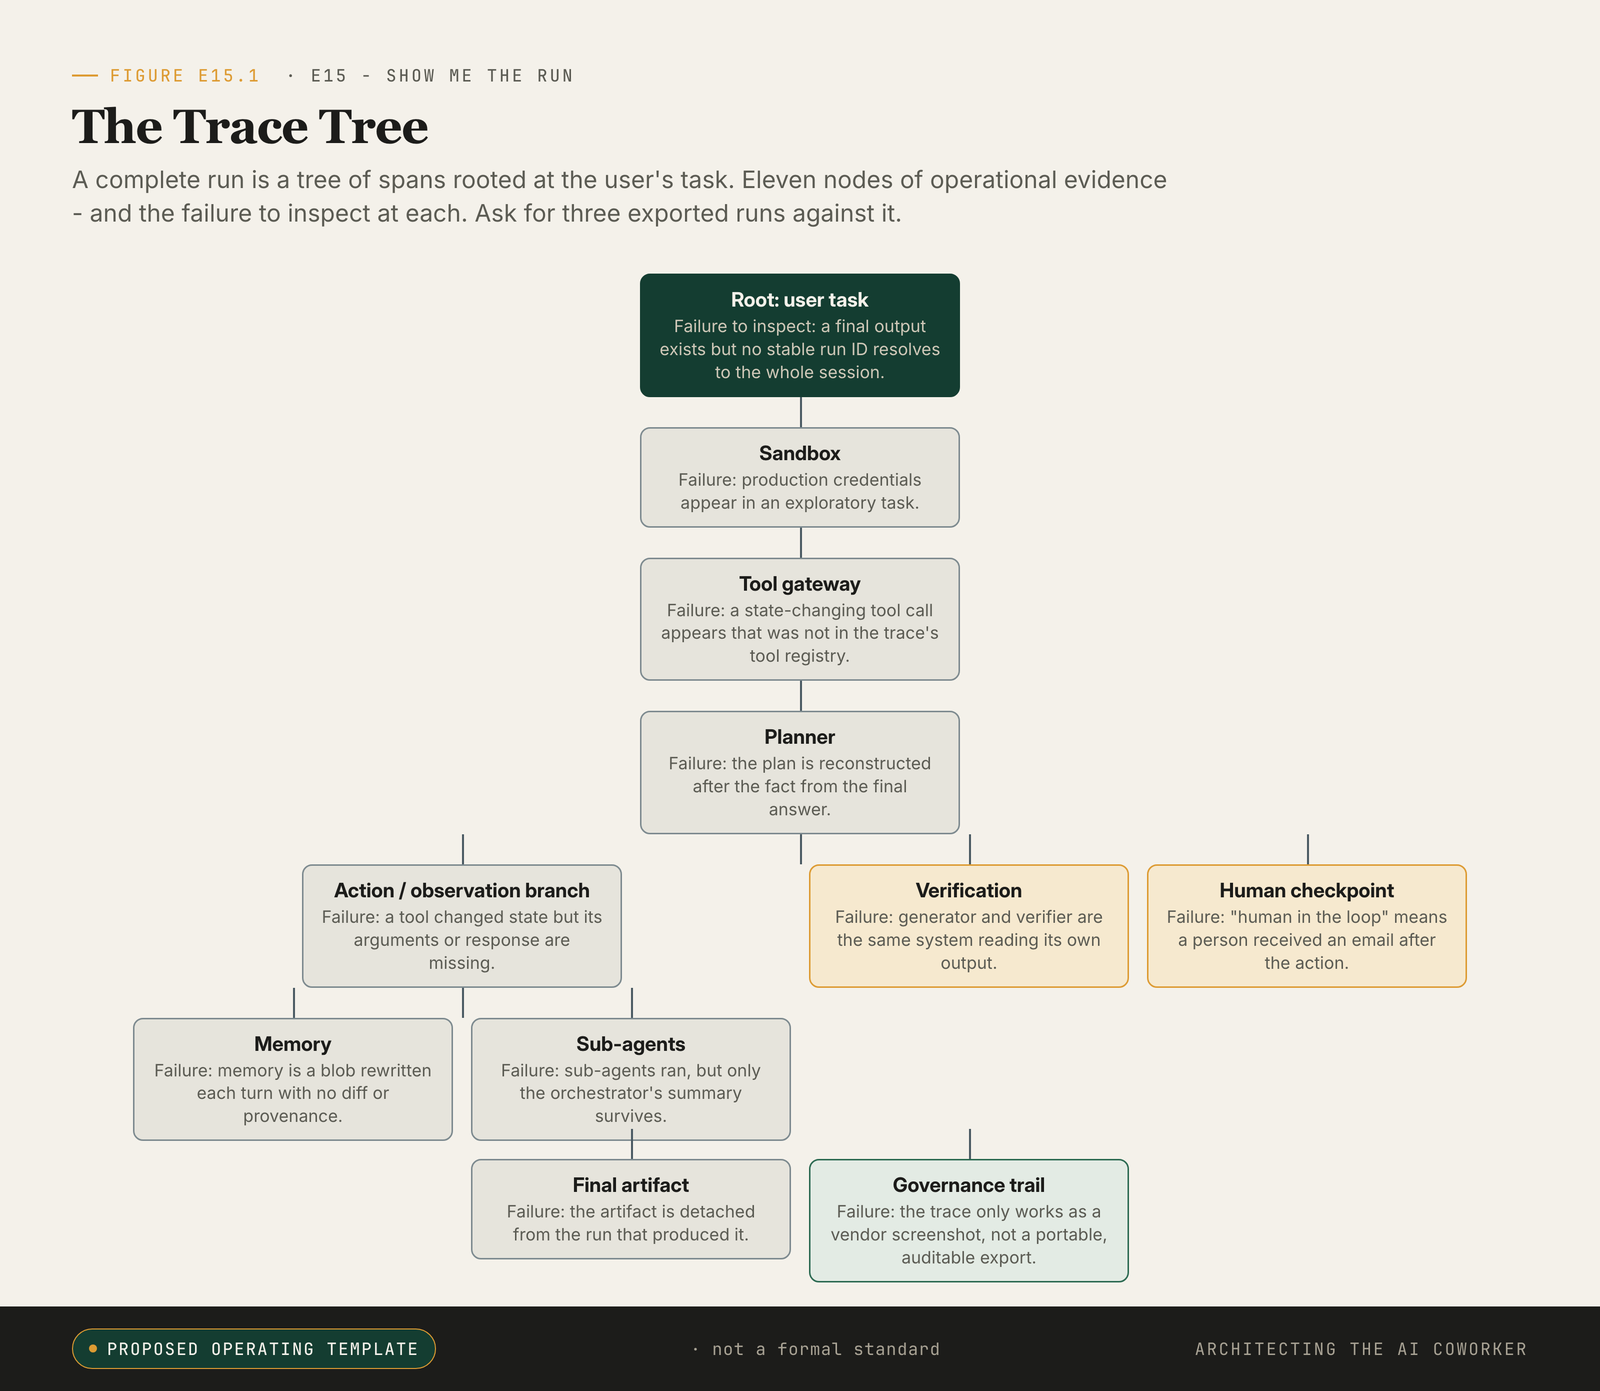
A trace tree is a procurement test: eleven nodes of operational evidence, and the failure at each. Ask for three exported runs against it: one successful, one failed, one near-miss.
If the vendor can produce only the final output and a latency chart, you are being asked to buy a system whose failure modes are, by construction, invisible to you. The output may be excellent. The benchmark may be impressive. The dashboard may be green. None of that tells you what happened inside the run, and what happened inside the run is the thing you will need on the day something goes wrong.
Whatever shape the work takes, the run should answer the same questions
Make the request concrete with two walkthroughs. They are disclosed reference shapes, not reported deployments or observed customer traces, but they cover most of what a production deployment looks like.
The first is a coding agent asked to investigate a bug: users with non-ASCII names, names with characters outside the basic Latin set, get an error when they save their profile. That run is tightly coupled and largely sequential. The agent reads the failing test, locates the handler, traces the error, proposes a patch, runs the targeted test, runs the broader test suite, opens a pull request, and stops. A pull request is the standard way an engineer proposes a code change for review. The human checkpoint is the pull request itself, because that is where the team's engineering review already lives. The right architecture composes with the checkpoints a team already has rather than bolting on new ones.
The second is a research agent asked to produce a 1,500-word brief on agent-identity standards. That run decomposes. An orchestrator, the agent that coordinates the others, splits the work into sub-questions, dispatches bounded sub-agents to chase each one, collects their notes, verifies the claims against the sources actually captured, synthesises the brief, and stops at human review.
Two different shapes, one identical inspection surface. The coding agent runs in a line and the research agent fans out, but the same plain questions should have answers either way, and those questions are exactly the nodes the trace tree in the figure already names. Walk them in order.
What was the task scoped to? What could the agent's sandbox reach, in files, network and credentials? Which tools were exposed to it? What plan did it write? How did the loop revise that plan, action by action, as observations came in?
What did its memory carry forward? Were any sub-agents spawned? What verifier ran? Where did a human enter? What was the final artefact, and does it link back to the run that produced it? And, holding all the rest together, does one run identifier resolve to the whole governance trail?
That last question is the hinge. If the run identifier does not resolve to the entire tree, the other ten answers are anecdotes. They are things the vendor told you, not things you can check.
Read the trace tree, and the lies a green dashboard tells go quiet
What does a complete run actually look like when you can read it? It looks like a tree. Each step is a span, a timed record of one unit of work, and each span has a parent, so the run viewed end to end is a tree of spans rooted at the user's task.
You do not need to memorise the standards that follow; you need them only as the vocabulary to point a vendor at. OpenTelemetry is the widely adopted open standard for software observability, the agreed format in which a system records what it did, span by span, so that any compatible tool can read the result. Its GenAI semantic conventions extend that format to agent and framework spans, including lifecycle operations such as creating an agent, invoking an agent, and invoking a workflow; those conventions still carry a Development status, the standard's own way of saying they are maturing and not yet frozen [1].
OpenInference defines a second OpenTelemetry-based span model for language-model applications, with named span kinds for the LLM, the agent, the chain, the tool, the retriever, the evaluator, and the guardrail ([2]; [3]). The vocabulary is becoming standard, and it does not belong to any one vendor. That is the point of pointing a vendor at it: whatever legal words a buyer answers to, the trace fields needed to explain a consequential run are the same.
The eleven nodes below are the author's synthesis, not a published instrument. They map onto the agent, framework, LLM, tool, retrieval and evaluator span kinds defined by the OpenTelemetry GenAI semantic conventions [1] and OpenInference ([2]; [3]), and onto the NIST AI Risk Management Framework's Measure function, which requires that identified AI risks be assessed, analysed and tracked through documented test data and operational evidence rather than self-attestation [11]. What the eleven nodes add is a procurement-grade reading order, translating those standards into the one-screen test below: the rightmost-column failure for each node is the lie a green dashboard can tell when the corresponding span is missing. It is an inspection artefact, not a transcript, and not evidence that any particular vendor emits these exact fields. It is the shape you should ask a vendor to map their system onto.
Read the table left to right: what each node must record, what good looks like, and the lie that the dashboard tells when that span goes missing.
| Node | Required fields | Success evidence | Failure node to inspect |
|---|---|---|---|
| Root: user task | trace_id, session.id, user intent, action requested, risk tier, policy version. | Run ID resolves to the session, artefact, spans, approvals, and versions. | Final output exists but no stable run ID resolves to the whole session. |
| Sandbox | Filesystem scope, network scope, credential scope, expiry, rollback path. | The run can show which files, hosts, credentials, and stores were reachable. | Production credentials appear in an exploratory task. |
| Tool gateway | Tool registry snapshot, typed definitions, permission grant, allowed and denied actions. | Called tools are a subset of tools listed at run start or granted mid-run with approval. | A state-changing tool call appears that was not in the trace's tool registry. |
| Planner | Initial plan, plan revision events, model version, prompt hash, relevant policy. | Revisions are timestamped and linked to observations. | The plan is reconstructed after the fact from the final answer. |
| Action/observation branch | Parent-child spans, tool arguments, outputs, errors, retries, timing. | Every state-changing call has arguments, observation, result, and caller. | Tool changed state but arguments or response are missing. |
| Memory | Working hypotheses, retrieved context, claim/source notes, memory writes, update history. | Memory entries are addressable and can be linked to later actions. | Memory is a blob rewritten each turn with no diff or provenance. |
| Sub-agents | Delegation reason, role, budget, inputs, returned notes, verifier status. | The orchestrator can show each delegation and how returned notes were used. | Sub-agents ran, but only the orchestrator's summary survives. |
| Verification | Test results, citation checks, evaluator identity, model family, deterministic checks, failure cases. | Verifier spans are structurally distinct from generator spans where stakes require it. | Generator and verifier are the same system reading its own output. |
| Human checkpoint | Approval screen, approver role, decision, rejected alternatives, escalation path. | Approval shows what the human saw before the action. | "Human in the loop" means a person received an email after the action. |
| Final artefact | Pull request, brief, ticket update, file diff, decision memo, or other deliverable. | The artefact links back to the trace and its evidence. | The artefact is detached from the run that produced it. |
| Governance trail | Joined links from run ID to spans, artefacts, model versions, policies, tools, approvals. | Export preserves parent-child relationships and can be audited outside the vendor story. | Trace only works as a vendor screenshot. |
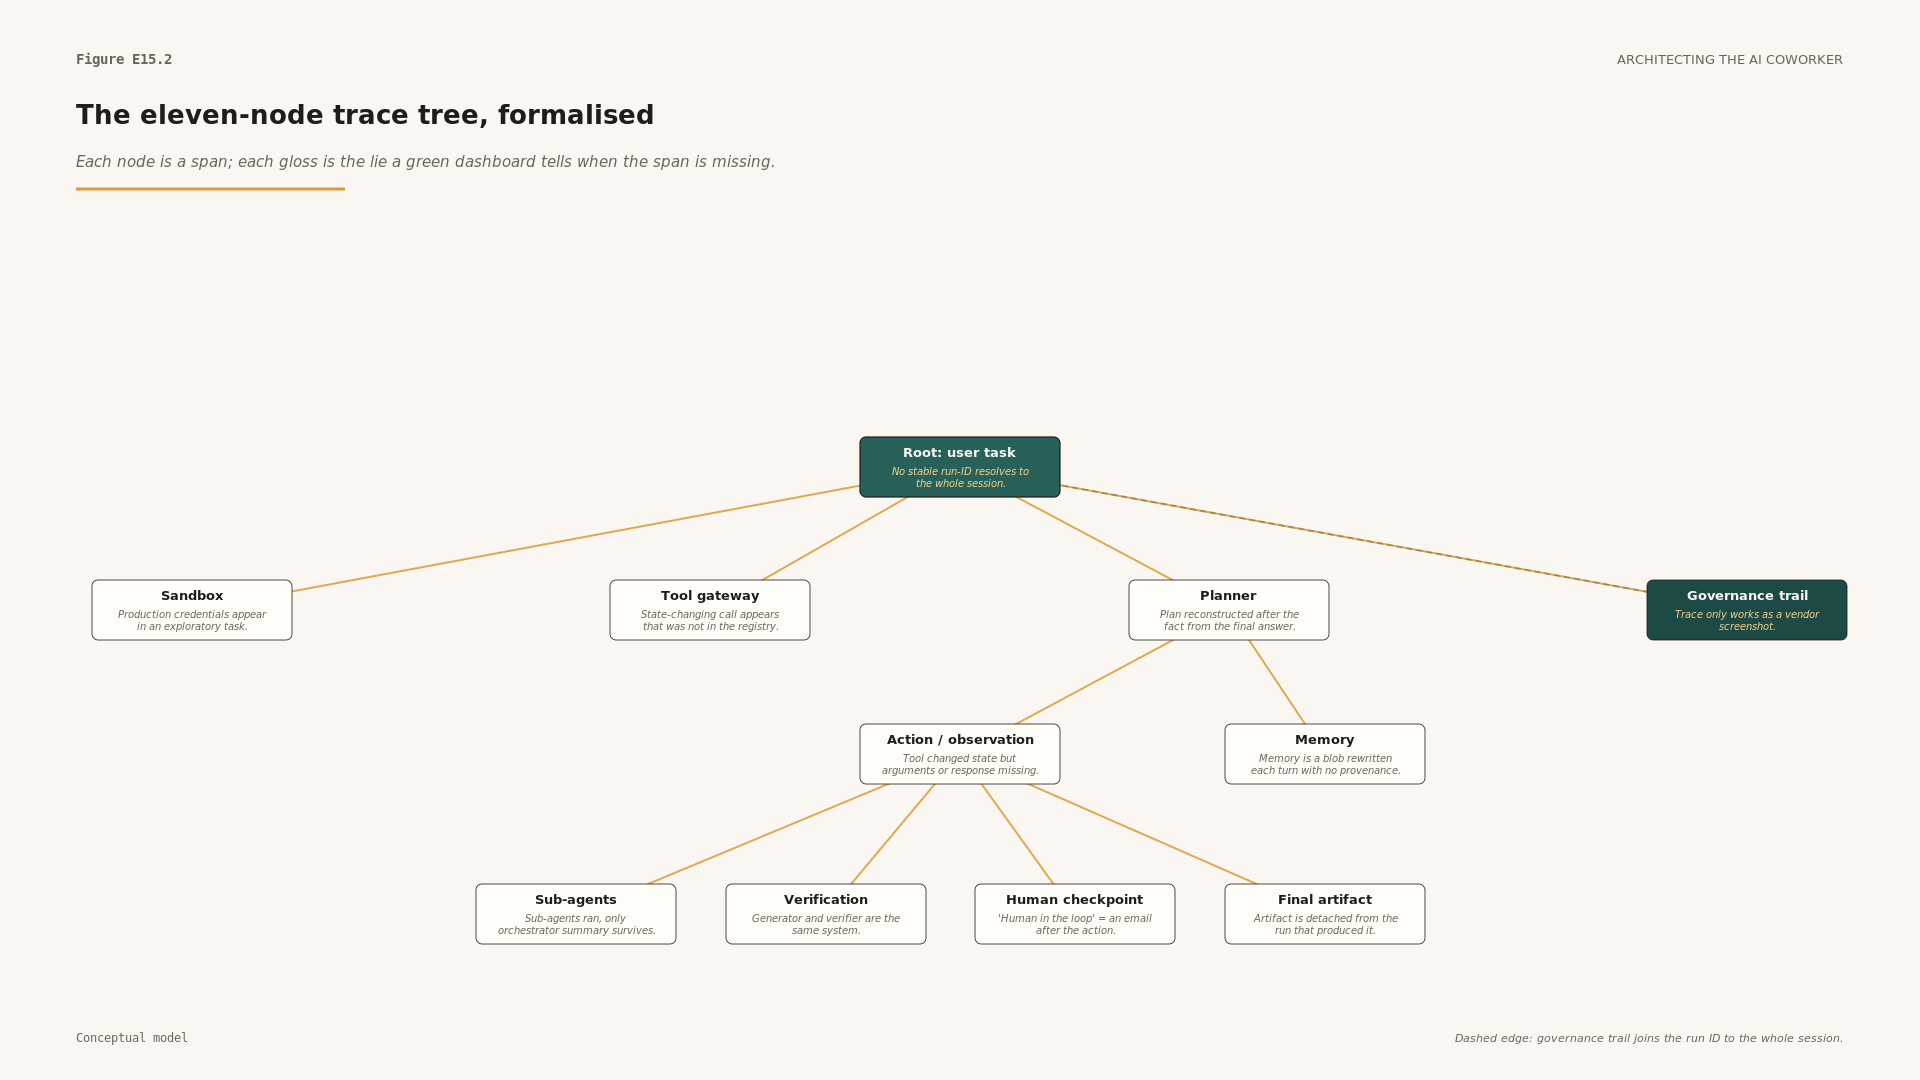
Figure E15.2. The eleven nodes drawn as a tree. Each node carries its name and the failure-line from the column above; the dashed edge to the governance trail is the join the run identifier must resolve.
Read down the rightmost column and you have a list of the lies a green dashboard can tell. The human checkpoint that turns out to be an email sent after the action. The sub-agents whose work survives only as a summary. The verifier that is the generator reading its own homework. These are not exotic failures. They are what "the agent completed the task" looks like once you turn it over.
The catch is that a vendor will never confess these failure modes in the table's own words. Take the verifier node, the one that matters most when the stakes are real. You say: "Show me the verifier span on this run." A common answer is: "We have a separate evaluation pipeline." That is not an answer to the question you asked; it is a different system. The verifier span is the check that ran inside this trajectory, on this decision, before the artefact shipped; an evaluation pipeline is an offline harness that may never have touched this run at all. A good answer points at two spans in the same tree carried by different model families, the generator producing the output and a structurally distinct evaluator judging it, with both timestamps inside the run. A bad answer points at a slide. The deflection is rarely a lie; it is a true statement about a neighbouring object, offered in place of the one you need. Which is why the buyer's real instrument is the one-level-deeper follow-up: not "do you verify?" but "show me the verifier span on this run, and tell me what model judged what."
One caution. Asking to see the run is not the same as asking for the model's private inner monologue. A trace tree records operational evidence: plans, summaries, actions, observations, tool payloads, verification results, approvals, artefacts. It is not a demand that the model expose hidden chain of thought, the model's internal reasoning text. The inspection question is not "what did the model privately think?" It is "what did the system do, what evidence did it rely on, and who approved the parts that mattered?"
Sidebar: benchmark drift. A reasonable person in that procurement meeting will push back here. We do have evidence, they will say, and they will point at benchmarks. They are right to. Benchmarks matter. They are population evidence: they tell you something real about how a system behaves across a set of tasks. They do not tell you what happened in this run, and the gap between those two things is wide.
Consider TheAgentCompany, a benchmark useful precisely because its tasks look more like office work than a short exam. Its headline completion rate is not one number but a moving one: it shifts with the benchmark version, the model, the scaffold around the model, and the scoring method, and the published versions of the benchmark do not agree with each other ([4]; [5]). That drift is not a scandal. It is a warning label, and it is the reason I will not quote a single completion percentage here as if it settled anything. A benchmark figure with no version, date, scaffold and scoring method attached is only half a sentence. METR's time-horizon work, which estimates how long a task a model can reliably complete, carries the same lesson in a different form: METR itself warns that its longer-horizon measurements are noisy and reports them with wide confidence intervals ([6]; [7]). Both are useful. Both are priors about how capable the frontier is.
Neither is a forensic account of one workflow inside your company. That is the gap the trace is built to close. The trace answers the question the benchmark cannot: where did this run succeed, where did it fail, which evidence existed at the time, and who had the authority to let it continue.
What if the vendor says "we have traces"?
So you ask for the run, and the vendor says, reasonably, "we have traces." That is not yet enough.
A trace that lives only inside a vendor's screenshot is better than nothing, but it is weak evidence. The buyer should ask which standard the trace maps to, whether it can be exported, and whether the export preserves the parts that matter: parent-child relationships, tool arguments, observations, retrieved context, verification spans, model versions, and approval events. OpenTelemetry and OpenInference do not make an agent trustworthy on their own. They make its evidence inspectable, which is a different and more modest thing. A vendor can conform perfectly to a trace schema and still ship a dangerous workflow. But a vendor that cannot show the run in a portable shape is asking you to trust the very thing that runtime evidence exists to replace: a story about what happened ([1]; [2]; [3]).
The practical test is simple, and I would make it slightly harder than buyers usually do. Do not ask for one successful run and one failed run. Ask for three exported runs: one successful, one failed, and one near-miss, the high-risk run that almost went wrong, escalated late, or sat one approval away from a bad outcome. There is a reason for the third. Failed runs are often the obvious ones, and a vendor knows which they are, so the failures you are shown tend to be tidy, well-sanitised, and unembarrassing. The near-miss is where governance actually lives or fails to: it shows you whether the stopping rule fired in time, whether the human checkpoint was real, and whether the system noticed its own danger before you did. Load all three into a trace viewer your own team controls (any OpenTelemetry- or OpenInference-compatible viewer will do: Jaeger, Grafana Tempo, or Arize Phoenix, for instance). Then try to answer the eleven questions without a vendor engineer narrating over your shoulder. If the trace works only as theatre, with the vendor as the storyteller, it is not audit evidence.
A near-miss does not stress all eleven nodes equally. It bears down hardest on three, and it is worth reading them as a unit. The Planner: when the observation turned dangerous, did the plan actually revise, or did the agent press on along the path it had already written? Verification: did a check fire at all on the risky step, or did the run sail past the point where a verifier should have spoken? And the Human checkpoint, the sharpest of the three: did escalation happen before the state change or after it? The whole governance question often collapses to that single ordering. A human who approved before the irreversible action governed it; a human who was notified after merely witnessed it.
Make it concrete. An agent handling a customer complaint drafts a refund at three times the policy limit. The trace shows the planner never revised when the amount crossed the threshold; the deterministic policy check that should have flagged the overage has no span; the approval screen does fire, but one second before submission, and the trace records the approver clicking through without ever opening the rejected alternatives the screen offered. Every node is technically present. The run "completed." A green dashboard would show one more resolved ticket. But read as a near-miss, the trajectory tells you exactly where the governance is hollow: the plan that did not bend, the check that did not exist, and the approval that resolved to a reflex rather than a decision. That is what it means to say the near-miss is where governance actually lives. You cannot see any of it in the successful run, because in the successful run nothing was tested.
A trace can protect privacy and still prove what happened
There is a worry that surfaces the moment a buyer asks for an exported run, and it is a legitimate one. A production trajectory touches real customers. It may carry names, account numbers, medical detail, the contents of a support ticket, the body of a contract. A security or data-protection officer is right to resist handing that out, and a vendor is right to be cautious about exporting it. So it is worth being precise: asking to see the run is not the same as asking to see the customer.
Redaction and provenance are separable, and a well-built trace keeps them separate. A trace export can mask or hash the raw personal data, the name, the account number, the free-text body, while preserving everything that makes the run governable: the class of each tool call rather than its private payload, the policy version in force, the model version that ran, the approval events and which role signed them, the run and action identifiers, the timing, and the parent-child structure of the tree. You can know that a state-changing tool was called, by which span, under which policy, approved by which role, without reading the customer's data at all. The governance trail survives redaction; only the personal content goes dark. A vendor who claims the run cannot be shared without exposing customer data is usually telling you that their trace was never designed to separate the two, and that is itself a finding worth having before Monday.
A sharper sceptic will press from the other side: a trace can be forged. So it can. But a forgery is not free, and the cost is exactly what makes the trace worth more than the number. A single dashboard figure is trivial to assert; one cell, one green tile, no internal structure to contradict. A coherent tree is a different problem.
To fabricate a convincing run you must produce parent-child spans whose timestamps stay consistent across the whole tree, tool payloads that actually match the observations they are supposed to have returned, verifier spans carried by a different model family from the generator, and approval events that resolve to named roles at the right moment in the ordering. Each added detail is another constraint that the rest of the forgery has to satisfy without contradicting itself, and the contradictions multiply faster than the story can absorb them. That is the whole point of exporting into a viewer you control rather than watching a narrated screenshot: you are not trusting the number, you are testing whether the run hangs together. A real trajectory hangs together because it happened. A fabricated one tends to come apart under the second question.
Set against all this is a counterargument I happen to think is right, as far as it reaches. Dashboards and aggregate evaluations are indispensable. Executives cannot read traces all day. Operators need trend views, latency alerts, cost monitoring, success and failure rates, release gates. If every decision required reading a span tree by hand, the organisation would simply stop doing the inspection, and stop is what undisciplined inspection always does. So yes, dashboards are necessary. But dashboards answer "how often", "how fast", "how expensive", and "how many". They do not answer "what happened in this run", "what evidence existed before the action", "which tool made the state change", or "where did the human approve it". The answer is not to replace dashboards with traces. The answer is to stop pretending the two are the same object. The operating habit I would set is modest: read one trajectory a week before you read the dashboard. Not because one run is statistically representative, it is not, but because reading real runs keeps the dashboard honest. Once you know what a trace can show, you know what an aggregate can hide.
The law is starting to ask for the run, not the number
Reading one run a week is a discipline you choose. The same demand is now arriving as a requirement, from three directions at once, because this is no longer only a matter of procurement hygiene. In Europe, the rules for high-risk AI require a system to keep automatic logs across its whole lifecycle, detailed enough that someone can later trace and monitor what it did [8]. Europe's operational-resilience rules for regulated finance, in force since January 2025, go further for that sector: a firm must be able to log, monitor and reconstruct operational events across its systems, which covers every coworker agent running inside it [9]. Canada's rules for government use of automated decisions take a third tack. They scale the obligations, notification, explanation, human review and peer review, to one of four impact levels, sized by how much each decision affects the person on the receiving end [10].
Three jurisdictions, one shared shape: reconstructing a single event, or proving the right control fired on a given decision, is a trace operation, not a metrics one. A buyer who can already export the eleven nodes is, by accident or design, closer to all three asks than the vendor whose only artefact is a green dashboard.
Not every gap weighs the same
Procurement is a decision, and a decision needs a function, not just a checklist. A missing run identifier at the Root, or a verifier that turns out to be the generator grading itself, is disqualifying: without the first you cannot resolve anything, and the second means the central check is theatre, so either one should stop the signature. A memory blob with no provenance is a conditional finding, real but survivable, the kind of thing you accept on paper only if the vendor commits to remediate it before go-live. And a thin sub-agent summary, where the orchestrator's notes survive but the delegations are sparse, is a question rather than a veto: you ask what was lost, and you weigh the answer. Disqualifying, conditional, or a question to resolve, that is the grading scale a buyer should carry into the room, so that "show me the run" produces a decision rather than a vague unease.
One honest admission belongs on that same table. No buyer has yet published a redacted production trace that exposes the full stack worth seeing: the sub-agent fan-out, the verifier output, the approval metadata, the model and policy versions, the tool payloads, the memory events, and a joined governance trail. That is exactly why the trace tree above is a reference example and not a screenshot. What the evidence does firmly support is narrower: benchmark claims need version discipline ([4]; [5]; [6]; [7]), and the trace vocabulary is becoming operational ([1]; [2]; [3]). That is not a reason to ask for less. It is the request.
So return to Dana, with the purchase order still unsigned in front of her. The deadline has not moved and the backlog has not shrunk. But she now has a better move than signing on the strength of a green dashboard, and a better move than refusing on instinct. She can ask for the runs. If the vendor can pull up three complete trajectories, exported, a success, a failure and a near-miss, and she can walk their eleven nodes without an engineer narrating, she has bought something she can actually govern. If the vendor cannot, she has learned the most important fact in the room, and learned it before Monday rather than after the first incident. If the path is invisible, the score is just a story. The question I would leave on the table is the one Dana should ask herself, and so should you: what would you learn from reading one production trajectory of your AI coworker, end to end, this week, and why have you not yet asked for it?
Carry This Forward
Tool: "Show me the run" is the procurement habit that comes before the dashboard. Before the next agent procurement decision, ask the vendor for three exported runs, one successful, one failed, and one near-miss, because the near-miss is where governance shows. Load all three into a trace viewer your own team controls and answer a few plain questions without anyone narrating: what did the agent read, which tools could it touch, what changed after the first failure, where did a human enter, and does the run identifier resolve to the whole tree? Ask for the export redacted: raw personal data masked, provenance kept, so privacy is no excuse for opacity. One run is not statistically enough. It is still enough to teach you what the aggregate may be concealing.
Next: Making the path visible only sharpens a subtler danger. A trace can show every step, in order, complete, and the meaning can still be wrong: the dashboard can be green while the run means something other than it appears to. Essay 16, "The Dashboard Is Green. The Meaning Is Wrong.", turns from artefacts to alerts and asks which cell of the syntax-by-meaning grid your dashboards were never built to see.
References
Primary records, regulator guidance, and vendor research underpinning this essay.
- 1OpenTelemetry, “OpenTelemetry GenAI agent spans”, 2026. Standard source
- 2Arize AI / OpenInference, “OpenInference specification”, 2026. Industry spec source
- 3Arize AI / OpenInference, “OpenInference traces”, 2026. Industry spec source
- 4Xu et al., “TheAgentCompany: Benchmarking LLM Agents on Consequential Real World Tasks”, 2025-09-10. Preprint source
- 5OpenReview / Xu et al., “TheAgentCompany OpenReview entry”, 2025-09. Academic source
- 6METR, “Time Horizon 1.1”, 2026-01-29. Independent evaluator source
- 7METR, “Task-Completion Time Horizons of Frontier AI Models”, 2026-05. Independent evaluator source
- 8European Parliament and Council, “Regulation (EU) 2024/1689 (EU AI Act), Article 12: record-keeping / logging for high-risk AI systems”, 2024-07-12. Official law source
- 9European Parliament and Council, “Regulation (EU) 2022/2554 (Digital Operational Resilience Act, DORA)”, 2022-12-14. Official law source
- 10Treasury Board of Canada Secretariat, “Directive on Automated Decision-Making and the Algorithmic Impact Assessment tool”, 2019-04-01. Official guidance source
- 11National Institute of Standards and Technology, “AI Risk Management Framework (AI RMF 1.0), Measure function”, 2023-01-26. Official guidance source
- 12U.S. District Court, D. Minn., “Kohls v. Ellison order re Hancock declaration”, 2025-01-10. Court record source
Exhibit — the LinkedIn deck
12 slides, swipeable. (Download it with the essay kit above.)
Slide 1 of 12