
Introduction
A few years ago I began working with the GMB Union as a co-founder of Datamise, helping to prepare and manage equal-pay claims. Across the wider campaigns we have supported, claims worth more than £350 million have now settled. Every time I see that figure written down, I still stop to think about it.
SettleMise started life as a tool I put together for negotiations in the Birmingham equal-pay settlement campaign. I was the only one building it, so I had to choose where to focus my energy. I brought data diagnosis, correction and valuation into one application. That seemed more practical when time was short and everyone needed a clear answer from the spreadsheets.
In this essay, I walk through how the workflow developed and the engineering decisions I faced along the way: how I dealt with messy data, why I moved from desktop to web, and what I learned from testing the calculation rules.
1. The reason for building SettleMise
Settlement negotiations can move much faster than the number crunching. Legal teams and caseworkers want to see, right there and then, what happens if they tweak an assumption. When the work depended on Excel, that meant hours of preparing data and adjusting spreadsheets. By the time the numbers were ready, the discussion could have moved on. That frustration pushed me to build a tool for exploring scenarios while the conversation was still happening.
The first headache was the input data. One unexpected column name can halt an import, or a missing pay grade can leave a batch of records unvalued. Finding the cause among thousands of spreadsheet rows is difficult without programming tools. The application needed to help caseworkers see which records were affected and what needed fixing.
So I included data-quality checks, calculation diagnostics and reference-data editors. Preparation became part of the valuation process: identify a problem, fix it in the right table, rerun the calculation and see the effect.
The users were union caseworkers and legal teams. Legal reviewers examined the assumptions and the resulting valuations. I developed the product in close cooperation with GMB and a claimant-side employment law firm for domain input.
SettleMise supports valuation and scenario review. Legal teams assess liability, select comparators and decide which assumptions to use in negotiations.

Figure 1. Import checks come first; calculation diagnostics lead into review, correction and another run.
2. Requirements and workload
Each valuation brings together claimant records, pay-grade rates and comparator rates: the reference pay used for comparison. The caseworker needs to work with those inputs without rebuilding the whole workbook every time something changes.
The functional requirements follow that job:
Getting the calculations right and providing clear diagnostics mattered more than reducing latency. A quicker result was no use unless the reviewer knew what had been calculated and what had been omitted. My non-functional priorities were:
The workload behind those choices
Much of the work involves running the analysis again: many claimant rows, smaller reference tables, and reruns whenever someone changes the data or an assumption. I was building for a specific group of caseworkers and legal reviewers, so reusable calculation logic and a straightforward request-response workflow made sense. Distributed processing would have added coordination work without solving their immediate problem.
3. The dashboard architecture
When I built the web version, I chose a layered modular monolith: one Next.js application containing both the browser interface and server-side processing, deployed on Vercel. As the sole developer, I could release updates centrally and test the valuation rules independently of the interface.
Three layers, one application
Modules organise the functional areas: import, calculation, diagnostics, analysis and export. A module can span layers; calculation, for example, involves a form, a workflow handler and valuation rules. These are parts of the same application, not separate services. The responsibilities remain recognisable when a different interface framework, hosting platform or storage mechanism implements them.
The layer names explain what the code does; the browser and server boundaries show where it runs. Claimant-file checks and dashboard exports run in the browser. Reference files also go to the server for processing. Valuation and requested analyses run on the server, while the browser calculates review metrics such as totals and liability drivers. Clerk supplies sign-in and identity; the application enforces access.

Figure 2. Layers separate responsibilities; the browser and server columns show where the work runs.
Browser snapshots retain working data on the user’s device. Reference imports and edited-data saves also write temporary server CSVs. These files support those operations; a calculation receives its inputs directly in the request and does not reload the files.
Following one calculation through the layers
When the caseworker presses Calculate, the presentation layer passes the action to the browser’s workflow handler. The handler gathers the current claimant rows, both reference tables and the assumptions, then sends them to the server. The API checks access and validates the request, including the valuation date and confirmation of assumptions, before calling the calculation module.
The processing layer returns calculated results, summaries and diagnostics. The application layer handles the response and updates the working state; the presentation layer displays the figures and records needing attention. A correction or changed assumption follows the same path on the next run.
Adding a calculation setting touches all three layers: a control to enter it, request validation to carry it, and a rule that uses it. I could test and release those changes together without another service. The cost was a shared release cycle and dependencies to manage between modules.
4. When the data is not ready for valuation
I’ll follow a synthetic case through the remaining steps. The caseworker has claimant records, a pay-grade table and comparator rates. Once the inputs are ready, they import the three files, check the data, confirm the assumptions and run the valuation. They then inspect the figures and exceptions, explore the analysis and export what they need for review.
In this case, several claimant records show grade 5, but that grade is not in the pay-grade table. The files are readable and contain the required columns. Some records still lack a rate needed for the calculation.
Looking at each spreadsheet individually, the headings appear normal and the claimant rows contain a grade. The problem appears when the calculation looks for that grade in the reference table and finds no matching rate.
When it encounters the missing grade, the calculation excludes the affected records and returns diagnostics explaining why. Other valid records still produce a working valuation. Before relying on the total, the caseworker examines the exceptions.
On the data-health review screen, the 'Missing Pay Grades' filter brings the affected records together. The caseworker can inspect a record and its missing grade. The suggested action is to add the reference or correct the claimant’s grade.

Figure 3. Data-health counts and review actions help the caseworker locate missing references.
Instead of asking, "What’s wrong with this spreadsheet?", the question becomes, "Why is this grade missing from the reference data?" Even when the answer seems obvious, the caseworker still needs to check the source files to find out which one is at fault.
Unreadable files and missing required columns stop processing with an upload or validation error.
The clips use synthetic demonstration data.
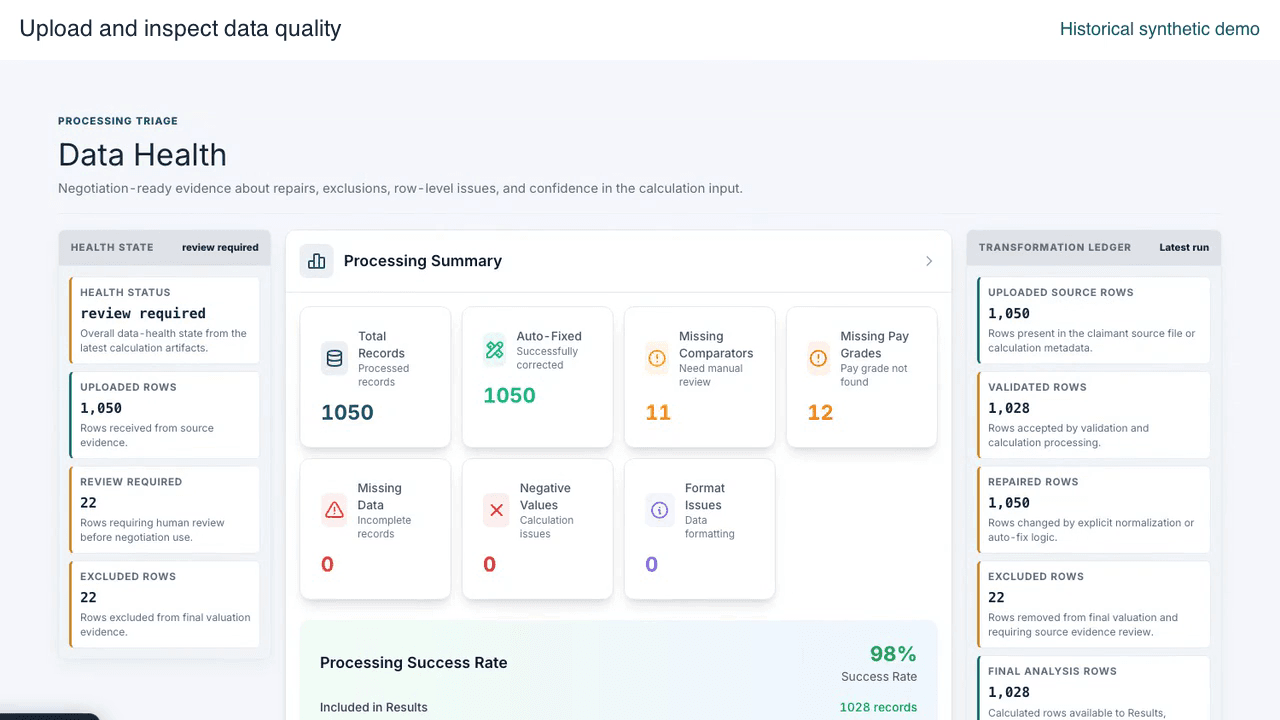
Clip 1. Importing the three synthetic datasets, inspecting column validation and reviewing reference gaps after calculation.
5. The design of the correction loop
I designed the correction loop around a distinction: some changes clean up how a value is written, while others change the evidence used in the valuation. Removing a redundant decimal from a whole-number grade is one operation; supplying a missing hourly rate is another.
The processing follows a sequence: recognise columns, interpret supported values, check required data, validate relationships against reference tables, then return results with diagnostics. The importer checks file structure and values; the calculation path checks the relationships needed to value each record.
Interpreting the file
Column mapping converts the source headers into the field names the application uses. Before using similarity matching, the mapper checks known names and aliases. The caseworker does not need to rename each supported variation manually.
The numeric parser accepts forms such as currency symbols and grouping separators and returns either a parsed value or an error. Field-level checks then decide whether the value is usable, for example by requiring positive weekly hours.
Pay grades show why this distinction matters. The values 5.0 and 5 represent the same whole-number grade, so the grade helper gives them the same lookup key. It flags a fractional value such as 5.5 for review instead of rounding it into another grade.
An ambiguous date needs context: 03/04/2025 can mean 3 April or 4 March. The import-quality report examines numeric dates in the dataset for evidence of day-first or month-first ordering and identifies cases that cannot be resolved. The dashboard import treats unresolved date order as an error for the caseworker to investigate.
I set things up so that formatting quirks are handled automatically, but decisions about missing source evidence stay with the reviewer. The system handles routine clean-up while people focus on the judgment calls.
From a missing reference to a useful diagnostic
The normalised grade acts as a lookup key. If the lookup finds no rate, the calculation excludes the record and returns a missing-pay-grade diagnostic. Many claimant records can depend on that one entry, so the caseworker can investigate a shared gap instead of searching thousands of rows separately.
Alongside its results, the calculation service returns diagnostics with the available row reference, issue category, processing stage, explanation and relevant values. The client transforms these into the review model, adding field-level descriptions and category-specific guidance.
For the missing grade, those details support the filtered view we just followed: which record was affected, which grade was missing and what action addresses it. The interface does not need to repeat the pay-rate lookup to explain why it failed.
I put that transformation in a separate helper so I could test how a server-side issue becomes a clear category and a recommended action for the user.

Figure 4. A missing grade moves from a calculation diagnostic through review, correction and rerun.
Correcting the reference and trying again
If the caseworker checks the source material and finds that the claimant records are correct but the reference table is missing grade 5, they open the pay-grade editor in the calculation section. They add the grade and its verified hourly rate.
The editor rejects blank or duplicate labels and requires a positive, finite numeric rate. The caseworker supplies that rate from the verified source.
The caseworker updates the working reference data and recalculates. The run handler uses the revised pay-grade table, making the correction available to all claimant records that refer to that grade. The caseworker then checks the new diagnostics and totals to see which records now calculate and which still need attention.
Editing changes the table in the editor. Save applies the changes to the working data and sends them to the server. Exporting produces a CSV that can be kept and reused in a later valuation. The original spreadsheet remains unchanged.
Once the missing rate is supplied and the rerun checked, the caseworker can return to the negotiation question: what happens under a different settlement assumption?
6. From fixed data to settlement scenarios
The rate added for grade 5 gives the caseworker a starting point for the discussion. They go through the returned records, check the remaining exceptions and review the valuation before changing an assumption. This first result is their working baseline.
A headline number can hide a lot of detail. In the analysis view, I break out claimant net and gross values, interest and employer contributions. Once the analysis is done, the reviewer can select a metric to inspect its formula, source fields and row counts, including missing or invalid values. This helps answer the practical question: "What’s actually included in this figure?"
Reconciliation bars display the totals side by side. Liability-driver tables break the valuation down by employer, role and pay grade so reviewers can inspect its main contributors.

Figure 5. A separate synthetic results example: claimant and employer totals, schedule detail and export controls.
Trying a different assumption
Before making changes, the caseworker keeps the initial export and the settings used to produce it. They can then compare the next result with a known starting point.

Figure 6. The caseworker reviews and confirms calculation assumptions before another run.
To examine a different interest-rate assumption, the caseworker keeps the corrected datasets and other settings unchanged, adjusts the rate, confirms the assumptions and calculates again. They then review the new result and update its analysis.
Changing one assumption makes the comparison easier to explain: the difference in the total comes from the altered rate, not another adjustment to the reference data.
For our example, the caseworker exports the calculated rows as a CSV for the reviewer. The dashboard also provides a PDF report option. Calculation settings and exception context need to accompany the figures.
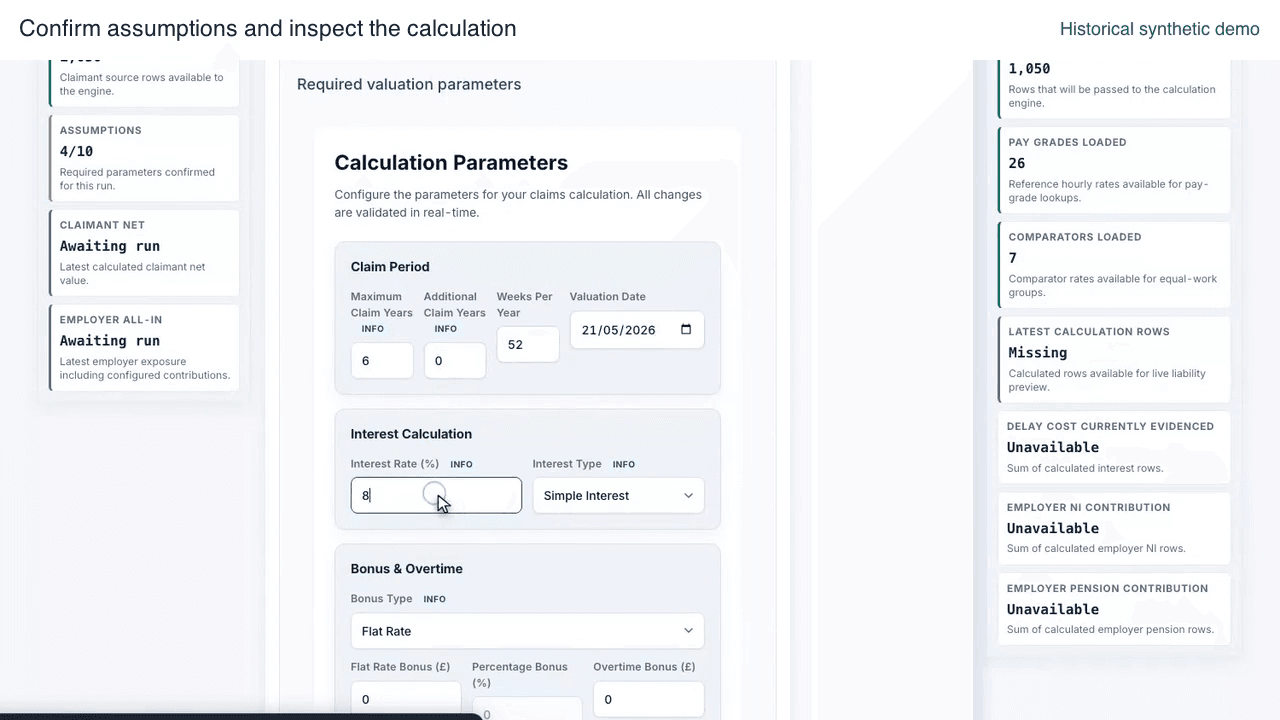
Clip 2. Confirming valuation settings, running the calculation and inspecting the review-required result and missing references.
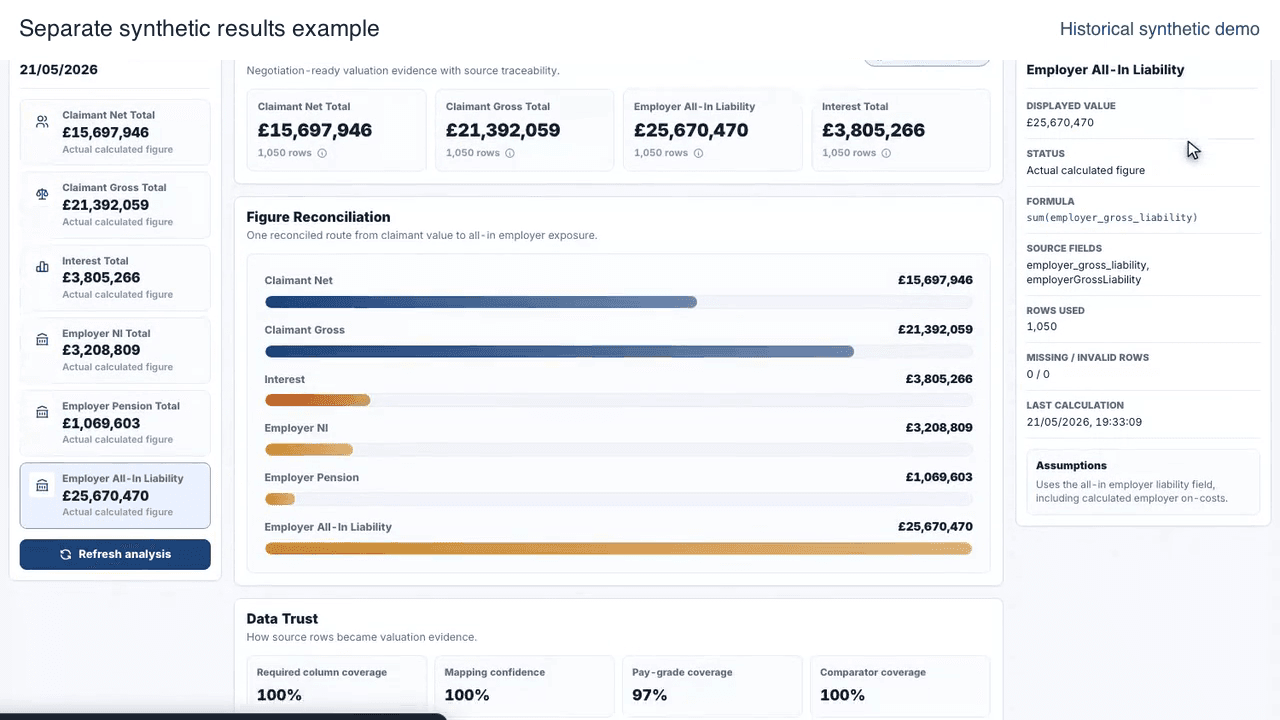
Clip 3. A separate synthetic results example: inspect totals, claimant detail and export controls, then explore the analysis.
7. Why I switched from desktop to web
SettleMise began as a Python application with a PyQt5 desktop interface. I used py2app to package the macOS application, which involved finding the native libraries needed for the build and managing Python dependencies. Even a minor adjustment to an import rule meant rebuilding and redistributing the application.
That’s what pushed me to move to the web: I could deploy fixes centrally, and users would load the updated application without installing a new desktop bundle. Since import handling and valuation controls were evolving, this made each release much less of a chore.
Vercel handled hosting and deployment. Moving to the web also made managed authentication easier to integrate. In the current setup, Clerk handles sign-in and identity, while my application checks access to the dashboard and processing routes. The web version previously used NextAuth before switching to Clerk.
The dependencies changed too: the workflow now needs a working network connection, a deployed app and an authentication service. With central delivery, I also have to keep an eye on release issues for everyone using that version. Even if the provider handles the infrastructure, I’m still responsible for configuration, access control, data handling and release checks.
Central delivery also required me to decide where to store the working data and saved results.
8. Data, interfaces and persistence
After a few rounds of repair and recalculation, the reviewer needs to know which inputs led to which results. In the grade-5 example, there’s an original reference table, a corrected version and valuations based on different assumptions. Calling all of this 'the case data' hides important differences.
I keep claimant rows, reference tables, calculation settings, results and diagnostics separate in the application. Each has a different role: correcting a pay-grade rate changes an input; adjusting interest changes an assumption; a missing-reference diagnostic explains an outcome. Keeping these distinctions in the data structures makes them easier to carry into the review interface.
The dashboard’s interfaces follow the same division:
POST /api/data receives pay-grade or comparator files and returns parsed tables. PUT /api/data writes edited working data as a temporary server CSV.POST /api/calculations receives claimant rows, both reference tables and settings, then returns calculated results, summaries and diagnostics.POST /api/analysis receives calculation results and analysis settings, then returns the analysis used by the dashboard.The browser store uses localStorage and IndexedDB to restore working data after a refresh. IndexedDB accommodates the larger calculation results. These snapshots help the caseworker pick up where they left off, while exported files provide a copy they can keep outside the browser.
For scenario comparison, the caseworker keeps the baseline export and its settings before a rerun updates the working result. In the grade-5 example, the corrected reference CSV stays with the reviewed output so the reviewer can trace the rate used in that valuation.
9. How I checked correctness and failure behaviour
I tested the processing rules separately from the interface: interpreting dates and grades, recognising column headings, and translating calculation diagnostics into fields and recommended actions. Tests of the reference-editor helpers check that blank labels, duplicate labels and invalid rates are rejected.
Pipeline tests cover cases where returning a number would be misleading. A missing valuation date produces an error instead of silently using today’s date. If every row lacks a comparator, the run fails with diagnostics rather than reporting an empty valuation as a success. The engine’s counts and diagnostics distinguish a valid record with no positive claim from one it cannot value.
For this case study, a separate reference calculator checks the application against fixed synthetic inputs, assumptions and expected outputs. It imports none of the application’s calculation code. That independence helps catch mistakes that tests built from the same helpers could repeat.
Six reference scenarios match the application’s output: a positive claim, a valid no-positive result, a missing comparator, malformed hours, a date resolved using evidence elsewhere in the dataset, and a rounding boundary. These comparisons exercise simple interest, flat tax rates and a flat bonus.
10. When a different architecture would be worthwhile
SettleMise does what I designed it to do: prepare valuation data and help explore settlement scenarios. I’m not planning to develop it further right now. But if enough organisations needed caseworkers and legal teams to collaborate on the same case, a centrally managed workspace would become useful. Everyone would need a clear view of the current data, know who made each correction, and have access to the history behind each valuation decision.
That would take central storage well beyond the current working-data model, with ongoing responsibilities for permissions, retention, recovery and security. I’d only take on that additional work if the customer base and workflow justified it.
For that workload, I’d consider a separate backend. The interface would stay focused on review and casework; the backend would handle longer-running calculations and more complex analysis for larger claims. Processing could then scale independently of the interface.
A bigger opportunity would be to handle the whole claim lifecycle: collecting information from claimants, cleaning and preparing it, helping with submission, and coordinating the case through to settlement. Valuation would be one part of that larger product. New users, access levels and responsibilities would require a new system design, not another version of SettleMise.
11. What I learned
The most valuable design choice I made was to connect stages of work that used to be scattered across spreadsheets: spotting a problem, understanding it, making a correction and seeing the results. A missing grade might seem like a small defect, but getting it right meant the importer, calculation service, diagnostic model and editor all had to agree on what the data meant.
I always check whether an error gives the user a clear next step, and whether another reviewer can tell the difference between a data correction and a changed assumption, even when I’m not there to explain it.
I’d choose a modular app and central web delivery again. There’s no prize for building something complicated just because it sounds impressive; extra infrastructure needs a reason in the workload or the way people collaborate.
I built SettleMise so caseworkers and legal teams could spend less time waiting for the next spreadsheet and more time exploring what happens when they change an assumption. That’s the purpose I kept in mind throughout, and the standard I used to judge its design.
Download the illustrated PDF · Open the standalone article and verification materials.