A mouse placenta on a glass slide is a difficult thing to measure. Stain it, scan it, and you have a whole-slide image with millions of cell nuclei, organised into tissue layers, carrying signal at two scales at once. My Oxford DPhil, Computational Insights into Mouse Placental Histology, asked a concrete question of that material: could computer vision turn it into structured biological evidence, and if so, how far down does the structure go?
The thesis answers in two halves. One half worked cleanly. The other did not, and the more interesting engineering lessons are in the half that did not.

The data: DMDD, mouse placenta, and 3 million nuclei
The histology came from the DMDD programme, Deciphering the Mechanisms of Developmental Disorders, a project studying embryonic-lethal mouse gene knockouts. DMDD is the source data, not my contribution; the thesis contributes the computational analysis built on top of it.
The tissue is mouse placenta, imaged as H&E-stained whole-slide images in NDPI pyramidal format. Whole-slide images are not ordinary model inputs. They are large fields of evidence where signal can live at tissue scale, at cellular scale, or in the relationship between the two. The placenta has distinct tissue layers, including the labyrinthine layer, which itself contains syncytiotrophoblast types 1 and 2, and the analysis has to respect that structure rather than flatten the slide into anonymous crops.
Two artefacts came out of the early dataset work, and both matter for everything that follows:
- A labelled training set, annotated against eight placental cell classes: Chorionic Plate (ChP), Decidua (DEC), Endothelial (END), Foetal (FET), Trophoblastic Giant (GIA), Glycogen (GLY), Labyrinth (LAB), and Spongiotrophoblast (SPO).
- An unlabelled set of 3 million cell-nucleus image samples, a 100×100-pixel patch extracted around each detected, centred nucleus. This set was never hand-labelled; it exists because the detection pipeline could run at scale.
That asymmetry, a modest annotated set against a vast unlabelled one, is the shape of almost every real medical-imaging problem. It is also what set up the central experiment of the thesis.
Detecting nuclei before classifying them
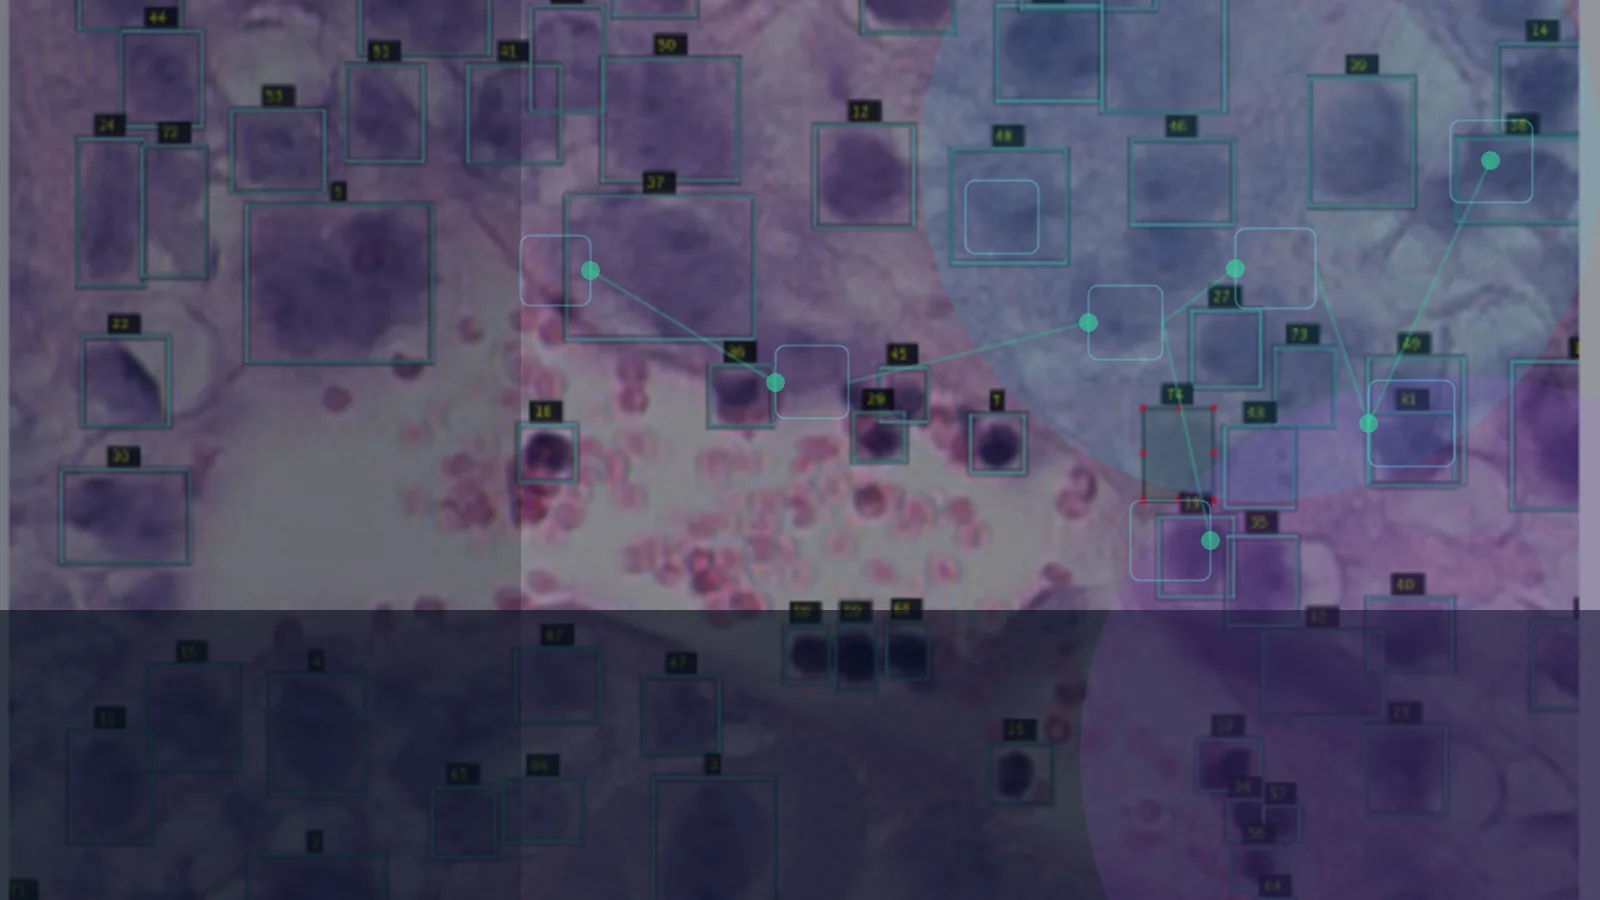
You cannot classify a cell you have not located. Chapter 5 builds the detection layer first: object-detection models, including RetinaNet and ResNet-backbone detectors, were investigated for finding nuclei across whole-slide images, with detection quality reported as mean Average Precision in a results table.
The point of the detection stage is not the detector. It is that running it at scale produced the 3-million-patch unlabelled dataset, each patch a fixed 100×100-pixel window centred on a nucleus. Detection turned an unmanageable slide into a manageable stream of consistent cell crops. Everything downstream operates on those crops.
The supervised classifier: 89% across eight classes
On the labelled DMDD training data, I trained a supervised model to assign each detected nucleus to one of the eight cell classes. It reached 89% classification accuracy, and that figure becomes the benchmark the rest of the thesis measures against.
The classifier earns a second job later. It produces a feature embedding, a 384-dimensional vector per nucleus, and in the unsupervised chapters it is reused as a feature extractor rather than retrained. Holding onto that embedding is what made the later experiments possible: it turned a trained classifier into a reusable lens on cell morphology.
Chapter 6 takes those features up a level. It segments the placenta into tissue regions using geometric methods (concave-hull tissue-boundary extraction, KD-Tree nearest-neighbour structures) and then uses classical models like Random Forest and XGBoost for the tabular tasks: characterising wild-type placentas, measuring sexual dimorphism between male and female placentas, phenotyping knockout lines against wild type, and predicting embryonic lethality from placental features. Statistical handling included Bonferroni correction for multiple comparisons and SMOTE for class imbalance. The output of this chapter is biological evidence in a table: candidate phenotype signals, not a diagnostic.
Interclass variance: the eight cell types separate cleanly
Chapter 7 frames the deeper question, and it frames it as two distinct problems. Interclass variance is variation between the eight cell types. Intraclass variance is variation within a single cell type, the subtypes a coarse label hides. The chapter runs five investigations across both.
The interclass problem turned out to be tractable. Working from the supervised feature embeddings, I first compared dimensionality-reduction techniques (PCA, t-SNE, and UMAP) and selected UMAP as the most effective at capturing both global and local structure in this high-dimensional data.
Then came a comparative clustering study. Four algorithms (K-Means, Spectral Clustering, HDBSCAN, and Gaussian Mixture Models) were run on the cell data and scored on five agreement metrics: Adjusted Rand Index, Adjusted Mutual Information, Homogeneity, Completeness, and V-measure.
One detail is worth pausing on. Cluster-count heuristics disagreed with the biology. The Elbow Method suggested 10 clusters; the Silhouette Score suggested 5, with 8 as a secondary candidate. The ground truth is 8. Neither heuristic settled on it cleanly: the Elbow Method degrades in high-dimensional spaces, and the Silhouette Score is biased toward fewer, convex clusters. So I did not let the heuristics pick. I standardised every algorithm at the known k = 8 and compared them on equal terms.
Loading clustering scorecard…
Spectral Clustering won on every metric, reaching roughly 0.99 across all five. K-Means was respectable at ARI 0.80; GMM trailed at 0.74; HDBSCAN failed outright at 0.30, sensitive to varying cluster density and high-dimensional noise. The result is narrower than "clustering works": one specific method, given the right k, recovers the eight cell types almost perfectly, and the others do not. The interclass structure is real and the supervised features expose it.
Intraclass variance: the harder problem, and the negative result
If the eight labels separate cleanly, the next question is whether there is meaningful structure inside a label. Do Trophoblastic Giant cells, for instance, come in distinguishable subtypes? Three investigations went looking, and this is where the thesis stops being a success story.
The supervised feature extractor could not find it. Applying UMAP and K-Means within each of the eight classes separately produced no distinct sub-clusters in any class. I tested embedding lengths of 128, 192, 256, 320, and 384 to rule out dimensionality as the cause; the lack of clustering persisted across all of them, so the curse of dimensionality was not the explanation. For every class, the Silhouette score consistently picked K = 2, which reads as the method finding no real substructure rather than finding two subtypes. The likely reason: the supervised model is over-specialised toward the interclass differences it was trained on, so it never learned the low-level features that finer intraclass distinctions would need.
That diagnosis motivated the obvious next move. If a label-trained model is too specialised to see subtle morphology, train a model without labels.
SimCLR was the self-supervised attempt. Using the contrastive framework from Chen et al. (2020), I trained a SimCLR model on the labelled set plus the unlabelled set of 3 million 100×100-pixel nucleus patches, 100 training epochs on the unlabelled data. Self-supervised learning does not optimise toward the eight labels, so in principle its features can carry morphology the supervised model discarded.
The qualitative results showed a flicker of something. Plotting SimCLR clusters for Giant cells revealed subtle separation: one cluster of overlapping cells, one of larger cells, one of elongated cells. The thesis is explicit that this "should not be taken as formal class separation"; it is a degree of separation ability, not proof of subtypes.
The quantitative results are where the experiment falls short of its goal.
Loading self-supervised result panel…
SimCLR scored 76% on the clean labelled set and 58% on the 3-million-image unlabelled set. Both beat the 12.5% chance baseline for eight classes comfortably. Both also fall short of the 89% supervised benchmark, and the 58% on the unlabelled set is the figure that matters: it is 31 points under the supervised model on the data the method was supposed to exploit. K-Means on SimCLR features again had the Silhouette score pick K = 2 for every class; neither the Silhouette score nor the Elbow method showed clean separation of the eight classes. The thesis lists the candidate causes plainly, fine-tuning, architecture limits, hyperparameters, or insufficient diversity in the training data, without isolating which one bites hardest.
So the verdict on intraclass variance is a negative result. No method tried, supervised feature extractor or SimCLR, definitively captured subtypes within a cell class. The 58% figure is a preliminary benchmark for future work, not a solved problem. Cell-class overlap is part of the difficulty: labyrinth cells, for example, group together syncytiotrophoblast types 1 and 2, which confounds any attempt to read fine structure. The future-work list is concrete: tune HDBSCAN and GMM, try other dimensionality-reduction methods, try other self-supervised frameworks such as SwAV, MoCo, or BYOL, and adopt a more granular classification scheme to begin with.
What the thesis established, and what it did not
It comes down to two sentences. Interclass variance, the eight cell types, was successfully captured: the supervised classifier reached 89%, and Spectral Clustering reached roughly 0.99 on every agreement metric. Intraclass variance, subtypes within a class, was not, by any method attempted.
The limits that bound those two sentences:
- The supervised model is over-specialised toward interclass differences, so it lacks the low-level features needed for subtle intraclass distinctions.
- SimCLR's 58% on the unlabelled set sits 31 points under the supervised benchmark and short of what the experiment aimed for; the cause is not isolated.
- Cluster-count heuristics gave wrong answers, 10 from the Elbow Method and 5 from the Silhouette Score against a true 8, so they cannot be trusted to set k in this domain.
- HDBSCAN performed poorly on this data and was not a viable clustering route here.
- The qualitative Giant-cell separation is not formal class separation.
On scope: this is computational analysis of mouse developmental-biology histology. It is not a placental-disease diagnostic, and it makes no clinical claim.
Why this still shapes how I build AI
The DPhil is the project that taught me to treat a model as one component inside an evidence system, not as the system itself. Detection only mattered because it produced 3 million consistent crops. The classifier only mattered because its 384-dimensional embedding became a reusable lens. The clustering study only meant something because I refused to let a broken heuristic pick k and instead pinned it to the known biology.
The part that travels furthest is the intraclass result: a careful experiment, measured against the 89% supervised baseline, that concluded the structure I went looking for is not reliably there. I report the same way now on evaluation work, multi-agent systems, and every benchmark I run. The claim never gets to run ahead of the numbers, and a negative result gets stated as flatly as a positive one.
A result and a frontier
The eight cell types separate cleanly; the subtypes inside them do not, by any method I tried. A 0.99 clustering score is a result. A 58% self-supervised benchmark is a frontier. Most of the skill in research is knowing which of the two you are holding — and reporting the frontier as flatly as the result, so the claim never runs ahead of the numbers. That mouse placenta carried signal at two scales; one yielded to computer vision and one did not, and separating them honestly is the whole result. A better embedding is not a discovery. A clean table is not a conclusion. The work is telling them apart.